USING THE PROGRAM
PlanMode is designed to provide you with instant results based on your input. There are no specific data requirements for using this app. A new financial profile starts building with your first entry. You can enter just one item (say Income) and review financial reports to see how they start to take shape. You will be prompted for additional information if needed to build the profile you ask for.
Your interaction is facilitated with menus containing buttons you can tap and input boxes to enter data in. In addition to data button each menu shows several smaller button in the bottom row that provide an easy way of move around in different sections of the app. Some of these buttons, such as the Back button, are dynamically interact to your tap based on your flow from one menu to another. These buttons are color coded for an efficient repetitive use.
WORKING WITH PLANMODE
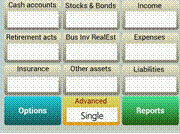
The main screen is displayed when you invoke PlanMode by tapping on its icon-
This screen is divided into two sections vertically; the upper (black) section for result display and the lower section for entering data and other app interactions. The result screen will be blank when you use this app for the first time on a device. On subsequent invocations it will either be blank or display the information from the last case you worked on depending on your default settings for the app.
For setting the default for starting a new case or continuing with the last case when you invoke PlanMode tap Options, Settings, Start With.
BASIC APP CATEGORIES
The internal structured consists of three main sections-
1. App navigation
2. Data input
3. Profiles & Reports
The app navigation provides the app settings and data management capabilities. Functions available for app navigation are represented with shades of blue. The data entry can be made directly in the data boxes of the main screen or, in details, via the data input grid. Non recurring data can be entered via the Advanced input section. The data input and options are represented in shades of gold and yellow colors. The Report section provides you the options to prepare different profiles of your financial plan and generate corresponding reports. This section for profiling and reporting is represented in shared of green color.
For data grid options tap Options, Settings, Input Mode
APP NAVIGATION
The Options tab on the main screen or any subsequent screens brings you to the main navigation screen
. 
Plan provides options to start a new plan from scratch, load a plan that was saved earlier on this device, save current plan and delete saved plans.
Settings can be used to setup default settings for this app. These settings will be applied to the current plan you are working on and will be saved as default settings applied to subsequent new plans. Settings include-

Input Mode - How you want to use the data buttons on the main screen. Options: Quick, Full or Flex.
In Quick mode you can make only one input per category on the virtual data entry key pad; tap anywhere on the button or input box the app will act as if the input box is tapped.
In Full mode an input grid is displayed where you can make multiple data entries. Input box entries are not permitted in Fill mode.
Flex mode permits entry in Quick mode and Full mode based on where you tap. A tap on the button opens up the grid for multiple data inputs, and a tap on the Input box permits you to make a single entry for the category directly on the virtual data entry box.

Start With – Your choice to either start PlanMode with a clean slate when invoked or load the last plan you were worked on.
Starting Year – The first year of the plan
Marital Status – Choices are Single or Married, with or without dependents. Married status is necessary if you need to perform analysis for survivor’s needs in case of either spouse’s death.
Planning Span – This setting can be used to force the planning span to a particular number of years. Otherwise the app will determine the life expectancy of each spouse based on IRS mortality tables. You need to have the age entered for the mortality table lookup.
Future Growth - Annual growth can be entered for projecting values in the future for each of the following categories-
- Bank Interest Rate
- Retirement Plan Growth
- Stocks & Bonds Growth
- Average Dividend Rate
- Business & Real Estate
- Other Assets
- Liabilities
- Income
- Expense
- Inflation Rate
- Discount Rate
- Tax Free Bond Yield
- Life Insurance CSV
Customize Results - Here you can describe report columns to display and/or print.
Planner Info – Your email address for emailing the reports
Income Tax – Your default choice to use the built-in US income tax calculations, define your own income tax computations or omit income taxes.
Settings for an individual plan can be further customize the under the Advanced tab
Compare This option can turn On or Off the Static or Dynamic functionality to automatically generate net comparison results as you enter each item of data.
Export PlanMode can export your data to ExecPlan (premier desktop financial.& tax planning system), Excel or as an ASCII file under this tab.
Help Activates the built-in app documentation and help information.
DATA INPUT
There are two different ways data can be entered depending on whether a item is recurring annually or applicable only in specific years. Most data items are generally recurring, for instance assets that you are not planning on liquidating or income and common expense items are recurring every year until retirement or later. An example of nonrecurring item could be the college expenses of one or more children that may apply in specific years only. Plan data of recurring items are entered on the main screen and the nonrecurring items can be input using the Advanced button.
Plan data for recurring items can be input on the main data input screen. Here you can input data based on your setting for Input Mode for Quick, Full or Flex modes. You can set the app up for any of these modes based on your usage needs.-
Quick Mode – allows you to enter one value for the button category by tapping anywhere on the button or the input box.
Full Mode – when your app is set to Full Mode a tap anywhere on the button or the input box opens up a data grid showing a list of items you can choose to enter data for.
Flex Mode – this option combines the Quick and Full modes; you can make a single entry for the button by tapping on the input box as in the Quick mode; enter specific data using the data grid as in the Full mode by tapping on the top of the button above the input box.
Input boxes on the main screen display the sum total of values entered for the button category in most cases. The color of these values describes how they were entered. Values entered directly in the input box are shown in black. If this sum is derived from data grid the value is shown as dimmed (gray color).
Customize input items with long tab press on the title
The title description of the item can be changed by a long tab on the title shown on the input grid (tab and hold for about 3 seconds).
To change input mode settings tap Options, Settings, Input Mode.
Advanced data input for nonrecurring items can be input using the Advanced tab on the main screen. The following menu sequence represents some of the choices available in the Advanced data input section-
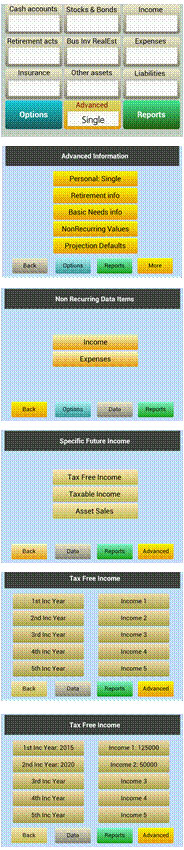
The advanced entry method includes the following data categories-
Tax Free Income
Taxable Income
Asset Sales (cash inflow)
Home Mortgage (automated computations)
Education Expenses
Special Events
Major Purchases (cash outflow)
Annual values can be entered by tapping on a tab in the first column to enter the year for which a value is to be entered. After entering the year (e.g., 2015) tap on the corresponding tab on the second column of the row to enter the value. The last screen sample above reflects how values for the years you enter are shown as input.
Profile and Report generation
Reports can be displayed at all stages of your plan development. They are generated for the selected profile. No specific data is required for the overall financial profile. For retirement, disability and survivor’s profile certain information related to age and the year of the event being analyzed is required. You will be prompted for such info if it is missing when you tap for a specific profile.
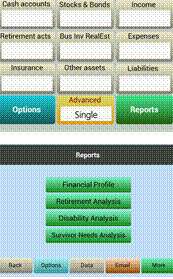
Menus related to profile selection and preparation of reports are shown in shades of green color
All reports are available by tapping on Reports on the main screen or on the Reports tab on the navigation options. First select a profile and then tap on the desired report from the report menu based on the profile selected-
Financial Profile reports reflect the plan profile with all current data projected year by year for the lifetime of both spouses (or the individual’s lifetime, if single). Following reports are available for the current year or projected through the planning span -
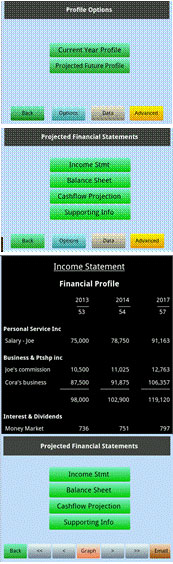
Income Statement reflects all taxable income and income taxes incurred.
Balance Sheet (Net Worth Statement) shows annual values net of income taxes
Cashflow Statement with eachstarting with the cash available at the beginning of the year and goes through each item of cash inflow and cash outflow in determining the cash balance available at the end of the year. The end-of-year cash balance is then used as the cash available at the beginning of the next year, thereby completing the cycle from the beginning of the first year and going through all years of the plan to the end of the last year of the planning horizon.
Supporting Schedule includes intermediate values computed for the taxable income and elements of income taxes.
Report display navigation – The projected reports are displayed subject to the limitations of the device. You can scroll reports up and down by swiping on the report display. Most devices can display only 3 columns of numbers of numbers at a time. You can scroll forward and backwards either 1 year at a time by tapping on > or < or 3 years at a time by tapping >> or <<.
To scroll 1 report year use or use
 to scroll 3 years at a time. Similarly use
 to go back one year and
 to go back to three years before the first year displayed. The years loop around at the first and last year of the plan.
Printed reports – The displayed reports can be emailed from the app to your email address. The printable reports are sent in the PDF format for easy viewing or printing. Note that the printable reports are generated for the 8.5”x11” page format. Therefore these reports can print up to 5 projected years per page.
Display selected years – You can select the years you want to display in results or on reports under the Customize Reports under the Options tab for default settings or Advanced tab for settings for this plan.. The customization can be done as a device default for this app or varied from one plan to another-
Numeric format – Numeric values in the results and reports can be displayed and printed in the following five formats-
English ###,###
French ###.###
Swiss ###’###
Latin ### ###
Indian #,##,###
Use the Customize Reports menu to select your choice. App defaults to English format.
Graphic overview - when a report is displayed a new button is shown on the bottom navigation row labeled Report, Graph or Chart. The projected reports can be displayed as Line Graphs for the entire planning horizon for a quick Birdseye’s view of the plan. Current year reports can be transposed into Pie Charts highlighting the proportions of key elements. Tap on this button to change the format of the results shown above.
Retirement Scenario reports reflect the financial profile during the retirement. PlanMode prepares these set of reports starting with the year after retirement and for a planning horizon covering the life span of the surviving spouse (or the individual’s lifetime, if single). Following reports are available -
Income Statement includes taxable income generated during retirement
Balance Sheet (Net Worth Statement) shows annual values net of taxes
Cashflow Statement from the beginning of year of first retirement to the end of last year of the surviving spouse.
Supporting Schedule includes income tax related items.
Retirement Analysis showing key analysis highlights of the retirement profile. In this analysis PlanMode looks at the lifetime funding needs and analyzes it with the income generated for its sufficiency. When income stops being sufficient to satisfy funding needs for expenses the Cash Management function methodically starts to liquidate retirement plans and other liquid assets to the extent needed to satisfy the need for living expense. Depending on the financial situation an analysis is generated for the scenario with sufficient or insufficient resources. This analysis also includes potential choices to fill a deficient void of resources. The analysis is mostly based on calculating and comparing the present values of streams of cash flows under various assumptions.
To review or change the discounting factor used in the calculation of the present values tap Advanced, Projection Defaults, Additional Items, Discount Rate-
Disability Scenario can be prepared for either spouse in any year of the plan. This event triggers two key items: the personal service income generated by the spouse assumed disabled stops and the disability insurance payments, if any, kick in. All financial reports are available to fully evaluate the lifelong financial profile in a disability scenario.
Income Statement includes taxable income generated starting in the year of disability
Balance Sheet (Net Worth Statement) shows annual values net of taxes
Cashflow Statement from the beginning of year of disability to the end of planning horizon.
Supporting Schedule includes income tax related items.
Disability Analysis showing key analysis highlights of the retirement profile. In this analysis PlanMode looks at the lifetime funding needs and analyzes it with the income generated for its sufficiency. When income stops being sufficient to satisfy funding needs for expenses the Cash Management function methodically starts to liquidate retirement plans and other liquid assets to the extent needed to satisfy the need for living expense. Depending on the financial situation an analysis is generated for the scenario with sufficient or insufficient resources. This analysis also includes potential choices to fill a deficient void of resources. The analysis is mostly based on calculating and comparing the present values of streams of cash flows under various assumptions.
Survivor’s Basic Needs Analysis is prepared for one spouse assuming the death of the other spouse. It can be prepared for either spouse in any year of the plan. Key events triggered in this scenario are: the personal service income generated by the first spouse stop in the event year, and the life insurance payments, if any, is received. All financial reports are available to fully evaluate the lifelong financial profile of the surviving spouse.
Income Statement includes taxable income generated starting in the year of death
Balance Sheet (Net Worth Statement) shows annual values net of taxes
Cashflow Statement from the beginning of year of this event to the last year of the surviving spouse.
Supporting Schedule includes income tax related items.
Survivor’s Needs Analysis summarizes lifelong needs of the surviving spouse and compares it with the income availability. In case this income and the proceeds of any life insurance are not sufficient this scenario extends into the availability of liquid assets. This analysis triggers the Cash Management function which methodically liquidates available liquid assets to the extent funds are needed to satisfy the living expenses in one or more years.
Depending on the financial situation in prevailing years an analysis is generated for the scenario with sufficient or insufficient resources. This analysis also calculates any need for additional life insurance to satisfy a shortfall situation.
Input Data Report contains the data items entered thus far in the plan. This report reflects the growth factor used for each input item along with any customization in item titles.